Summary: retire the secondary Prometheus server, merging into a private, high availability cluster completed in 2025, retire Icinga in September 2024.
- Background
- Personas
- Proposal
- Challenges
- Alternatives considered
- Costs
- References
- Appendix
Background
As part of the fleet-wide Debian bullseye upgrades, we are evaluating whether it is worth upgrading from the Debian Icinga 1 package to Icinga 2, or if we should switch to Prometheus] instead.
Icinga 1 is not available in Debian bullseye and this is therefore a mandatory upgrade. Because of the design of the service, it cannot just be converted over easily, so we are considering alternatives.
This has become urgent as of May 2024, as Debian buster will stop being supported by Debian LTS in June 2024.
History
TPA's monitoring infrastructure has been originally setup with Nagios and Munin. Nagios was eventually removed from Debian in 2016 and replaced with Icinga 1. Munin somehow "died in a fire" some time before anarcat joined TPA in 2019.
At that point, the lack of trending infrastructure was seen as a serious problem, so Prometheus and Grafana were deployed in 2019 as a stopgap measure.
A secondary Prometheus server (prometheus2) was setup with stronger
authentication for service admins. The rationale was that those
services were more privacy-sensitive and the primary TPA setup
(prometheus1) was too open to the public, which could allow for
side-channels attacks.
Those tools has been used for trending ever since, while keeping Icinga for monitoring.
During the March 2021 hack week, Prometheus' Alertmanager was deployed on the secondary Prometheus server to provide alerting to the Metrics and Anti-Censorship teams.
Current configuration
The Prometheus configuration is almost fully Puppetized, using the Voxpupuli Prometheus module, with rare exceptions: the PostgreSQL exporter needs some manual configuration, and the secondary Prometheus servers has a Git repository where teams can submit alerts and target definitions.
Prometheus is currently scraping 160 exporters, including 88 distinct hosts. It is using about 100GB of disk space, scrapes metrics every minute, and keeps those metrics for a year. This implies that it does about 160 "checks" per minute, although each check generates much more than a single metric. We previously estimated (2020) an average of 2000 metrics per host.
The Icinga server's configuration is semi-automatic: configuration is kept in a YAML file the tor-nagios.git repository. That file, in turn, gets turned into Nagios (note: not Icinga 2!) configuration files by a Ruby script, inherited from the Debian System Administrator (DSA) team.
Nagios's NRPE probes configuration get generated by that same script and then copied over to the Puppet server, which then distributes those scripts to all nodes, regardless of where the script is supposed to run. Nagios NRPE checks often have many side effects. For example, the DNSSEC checks automatically renew DNSSEC anchors.
Icinga is currently monitoring 96 hosts and 4400 services, it using 2GiB of disk space. It scrapes about 5% of services every minute, takes 15 minutes to scrape 80% and an hour to scrape 93% of services. The 100 hosts are typically tested for reachability within 5 minutes. It processes about 250 checks per minute.
Problem statement
The current Icinga deployment cannot be upgraded to Bullseye as is.
At the very least the post-receive hook in git would need to be rewritten to
support the Icinga 2 configuration files, since Icinga 2 has dropped
support for Nagios configurations.
The Icinga configuration is error-prone: because of the way the script
is deployed (post-receive hook), an error in the configuration can
go un-detected and not being deployed for extended periods of time,
which had lead some services to stay unmonitored.
Having Icinga be a separate source of truth for host information was originally a deliberate decision: it allowed for external verification of configurations deployed by Puppet. But since new services must be manually configured in Icinga, this leads to new servers and services not being monitored at all, and in fact many services do not have any form of monitoring.
The way the NRPE configuration is deployed is also problematic: because the files get deployed asynchronously, it's common for warnings to pop up in Icinga because the NRPE definitions are not properly deployed everywhere.
Furthermore, there is some overlap between the Icinga and Prometheus/Grafana services. In particular:
-
Both Icinga and Prometheus deploy remote probes (Prometheus "exporters" and Nagios NRPE)
-
Both Icinga and Grafana (and Prometheus) provide dashboards (although Prometheus' dashboard is minimal)
-
Both Icinga and Prometheus retain metrics about services
-
Icinga, Prometheus, and Grafana can all do alerting, both Icinga and Prometheus are currently used for alerting, TPA and service admins in the case of Icinga, only service admins for Prometheus right now
Note that weasel has started on rewriting the DSA Puppet configuration to automatically generate Icinga 2 configurations using a custom Puppet module, ditching the "push to git" design. This has the limitation that service admins will not have access to modifying the alerting configuration unless they somehow get access to the Puppet repository. We have the option of automate Icinga configuration of course, either with DSA's work or another Icinga module.
Definitions
-
"system" metrics: directly under the responsibility of TPA, for example: memory, CPU, disk usage, TCP/IP reachability, TLS certificates expiration, DNS, etc
-
"user" metrics: under the responsibility of service admins, for example: number of overloaded relays,
bridges.torproject.orgaccessibility -
alerting: checking for a fault related to some metric out of a given specification, for example: unreachable host, expired certificate, too many overloaded relays, unreachable sites
-
notifications: alert delivered to an operator, for example by sending an email (as opposed to just showing alerts on a dashboard)
-
trending: long term storage and rendering of metrics and alerts, for example: Icinga's alert history, Prometheus TSDB, Grafana graphics based on Prometheus
-
TSDB: Time-Series Database, for example: Prometheus block files, Icinga log files, etc
Requirements
This section establishes what constitutes a valid and sufficient monitoring system, as provided by TPA.
Must have
-
trending: it should be possible to look back in metrics history and analyse long term patterns (for example: "when did the disk last fill up, and what happened then?" or "what is the average latency of this service over the last year?")
-
alerting: the system should allow operators to set "normal" operational thresholds outside of which a service is considered in "fault" and an alert is raised (for example: "95 percentile latency above 500 ms", "disk full") and those thresholds should be adjustable per-role
-
user-defined: user-defined metrics must be somehow configurable by the service admins with minimal intervention by TPA
-
status dashboard: it MUST be possible for TPA operators to access an overview dashboard giving the global status of metrics and alerts service admins SHOULD also have access to their own service-specific dashboards
-
automatic configuration: monitoring MUST NOT require a manual intervention from TPA when a new server is provisioned, and new components added during the server lifetime should be picked up automatically (eg. adding apache via Puppet should not require separately modifying monitoring configuration files)
-
reduced alert fatigue: the system must provide ways avoid sending many alerts for the same problem and to minminize non-relevant alerts, such as acknowledging known problems and silencing expected alerts ahead of time (for planned maintenance) or on a schedule (eg. high i/o load during the backup window)
-
user-based alerting: alerts MUST focus on user-visible performance metrics instead of underlying assumptions about architecture (e.g. alert on "CI jobs waiting for more than X hours" not "load too high on runners"), which should help with alert fatigue and auto-configuration
-
timely service checks: the monitoring system should notice issues promptly (within a minute or so), without having to trigger checks manually to verify service recovery, for example
-
alert notifications: it SHOULD be possible for operators to receive notifications when a fault is found in the collected metrics (as opposed to having to consult a dashboard), the exact delivery mechanism is left as a "Nice to have" implementation detail
-
notification groups: service admins SHOULDN'T receive notification from system-level faults and TPA SHOULDN'T receive notifications from service-level faults, service A admin should only receive alerts for service A and not service B
Nice to have
-
Email notifications: alerts should be sent by email
-
IRC notifications: alerts should be transmitted in an IRC channel, for example the current
nsabot in#tor-nagios -
Matrix notifications: alerts may be transmitted over Matrix instead of IRC, assuming this will not jeopardize the reliability of notifications compared to the current IRC notifications
-
predictive alerting: instead of raising an alert after a given threshold (e.g. "disk 90% full"), notify operators about planned outage date (e.g. "disk will be full in 5 days")
-
actionable notifications: alert dashboards or notifications should have a clear resolution path, preferably embedded in the notification or, alternatively, possible to lookup in a pager playbook (example: "expand this disk before 5 days", "renew the DNSSEC records by following this playbook"; counter-example: "disk 80% full", "security delegations is WARNING")
-
notification silences: operators should be able to silence ongoing alerts or plan silences in advance
-
long term storage: it should be possible to store metrics indefinitely, possibly with downsampling, to make long term (multi-year) analysis
-
automatic service discovery: it should be possible for service admins to automatically provide monitoring targets to the monitoring server without having to manually make changes to the monitoring system
-
tool deduplication: duplication of concern should be reduced so that only one tool is used for a specific tasks, for example only one tool should be collecting metrics, only one tool should be issuing alerts, and there should be a single, unified dashboard
-
high availability: it should be possibly for the monitoring system to survive the failure of one of the monitoring nodes and keep functioning, without alert floods, duplicated or missed alerts
-
distributed monitoring endpoints: the system should allow operators to optionally configure checks from multiple different endpoints (eg. check gnt-fsn-based web server latency from a machine in gnt-chi)
Out of scope
- SLA: we do not plan on providing any specific Service Level Agreement through this proposal, those are still defined in TPA-RFC-2: Support.
-
on-call rotation: we do not provide 24/7 on-call services, nor do we ascribe to an on-call schedule - there is a "star of the weeks" that's responsible for checking the status of things and dealing with interruptions, but they do so during work hours, in their own time, in accordance with TPA-RFC-2: Support
In particular, we do not introduce notifications that "page" operators on their mobile devices, instead we keep the current "email / IRC" notifications with optional integration with GitLab.
We will absolutely not wake up humans at night for servers. If we desire 24/7 availability, shifts should be implemented with staff in multiple time zones instead.
-
escalation: we do not need to call Y when X person fails to answer, mainly because we do not expect either X or Y to answer alerts immediately
-
log analysis: while logging might eventually be considered part of our monitoring systems, the questions of whether we use syslog-ng, rsyslog, journald, or loki are currently out of scope of this proposal
-
exporter policy: we need to clarify how new exporters are setup, but this is covered by another issue, in tpo/tpa/team#41280
- incident response: we need to improve our incident response procedures, but those are not covered by this policy, see tpo/tpa/team#40421 for that discussion
- public dashboards: we currently copy-paste screenshots into GitLab when we want to share data publicly and will continue to do so, see the Authentication section for more details
- unsupported services: even though we do monitor the underlying infra, we don't monitor services listed in unsupported services, as this is the responsibility of their own Service admins.
Personas
Here we collect some "personas", fictitious characters that try to cover most of the current use cases. The goal is to see how the changes will affect them. If you are not represented by one of those personas, please let us know and describe your use case.
Ethan, the TPA admin
Ethan is a member of the TPA team. He has access to the Puppet repository, and all other Git repositories managed by TPA. He has access to everything and the kitchen sink, and has to fix all of this on a regular basis.
He sometimes ends rotating as the "star of the week", which makes him responsible for handling "interruptions", new tickets, and also keeping an eye on the monitoring server. This involves responding to alerts like, by order of frequency in the 12 months before 2022-06-20:
- 2805 pending upgrades (packages blocked from unattended upgrades)
- 2325 pending restarts (services blocked from needrestart) or reboots
- 1818 load alerts
- 1709 disk usage alerts
- 1062 puppet catalog failures
- 999 uptime alerts (after reboots)
- 843 reachability alerts
- 602 process count alerts
- 585 swap usage alerts
- 499 backup alerts
- 484 systemd alerts e.g. systemd says "degraded" and you get to figure out what didn't start
- 383 zombie alerts
- 199 missing process (e.g. "0 postgresql processes")
- 168 unwanted processes or network services
- numerous warnings about service admin specific things:
- 129 mirror static sync alert storms (15 at a time), mostly host unreachability warnings
- 69 bridgedb
- 67 collector
- 26 out of date chroots
- 14 translation cron - stuck
- 17 mail queue (polyanthum)
- 96 RAID - DRBD warnings, mostly false alerts
- 95 SSL cert warnings about db.torproject.org, all about the same problem
- 94 DNS SOA synchronization alerts
- 88 DNSSEC alerts (81 delegation and signature expiry, 4 DS expiry, 2 security delegations)
- 69 hardware RAID warnings
- 69 Ganeti cluster verification warnings
- numerous alerts about NRPE availability, often falsely flagged as an error in a specific service (e.g. "SSL cert - host")
- 28 unbound trust alerts
- 24 alerts about unexpected software RAID
- 19 SAN health alerts
- 5 false (?) alerts about mdadm resyncing
- 3 expiring Let's Encrypt X509 certificates alerts
- 3 redis liveness alerts
- 4 onionoo backend reachability alerts
Ethan finds that is way too much noise.
The current Icinga dashboard, that said, is pretty useful in the sense that he can ignore all of those emails and just look at the dashboard to see what's actually going on right now. This sometimes causes him to miss some problems, however.
Ethan uses Grafana to diagnose issues and see long term trends. He builds dashboards by clicking around Grafana and saving the resulting JSON in the grafana-dashboards git repository.
Ethan would love to monitor user endpoints better, and particularly wants to have better monitoring for webserver response times.
The proposed changes will mean Ethan will completely stop using Icinga for monitoring. New alerts will come from Alertmanager instead and he will need to get familiar with Karma's dashboard to browse current alerts.
There might be a little bit of a bumpy ride as we transition between both services, and outages might go on unnoticed.
Note
The alert list was created with the following utterly horrible shell pipeline:
notmuch search --format=sexp  tag:nagios date:1y.. \
  | sed -n '/PROBLEM/{s/.*:subject "//;s/" :query .*//;s/.*Alert: [^\/ ]*[\/ ]//;p}' \
  | sed -e 's/ is UNKNOWN.*//' -e 's/ is WARNING.*//' -e 's/ is CRITICAL.*//' \
    -e 's/disk usage .*/disk usage/'\
    -e 's/mirror static sync.*/mirror static sync/' \
    -e 's/unwanted.*/unwanted/' \
    -e '/DNS/s/ - .*//' \
    -e 's/process - .*/process/' \
    -e 's/network service - .*/network service/' \
    -e 's/backup - .*/backup/' \
    -e 's/mirror sync - .*/mirror sync/' \
    | sort | uniq -c | sort -n
Then the alerts were parsed by anarcat's brain to make them human-readable.
Jackie, the service admin
Jackie manages a service deployed on TPA servers, but doesn't have administrative access on the servers or the monitoring servers, either Icinga or Prometheus. She can, however, submit merge requests to the prometheus-alerts repository to deploy targets and alerting rules. She also has access to the Grafana server with a shared password that someone passed along. Jackie's primary role is not as a sysadmin: she is an analyst and/or developer and might actually be using other monitoring systems not managed by TPA at all.
Jackie manages everything through her email right now: all notifications end up there and can be correlated regardless of the monitoring system.
She would love to use a more normal authentication method than sharing the password, because that feels wrong. She wonders how exporters should be setup: all on different ports, or subpaths on the same domain name? Should there be authentication and transport-layer security (TLS)?
She also feels clicking through Grafana to build dashboards is suboptimal and would love to have a more declarative mechanism to build dashboards and has, in fact, worked on such a system based on Python and grafanalib. She directly participates in the discussion to automate deployment of Grafana dashboards.
She would love to get alerts over Matrix, but currently receives notifications by email, sometimes to a Mailman mailing list.
Jackie absolutely needs to have certain dashboards completely private, but would love if some dashboards can be made public. She can live with those being accessible only to tor-internal.
Jackie will have to transition to the central Prometheus / Grafana server and learn to collaborate with TPA on the maintenance of that server. She will copy all dashboards she needs to the new server, either by importing them in the Git repository (ideally) or by copying them by hand.
The metrics currently stored in prometheus2 will not be copied over
to the new server, but the old prometheus2 server will be kept
around as long as necessary to avoid losing data.
Her alerts will continue being delivered by email to match external monitoring systems, including for warnings. She might consider switching all monitoring systems to TPA's Prometheus services to have one central dashboard to everything, keeping notifications only for critical issues.
Proposal
The current Icinga server is retired and replaced by a pair of Prometheus servers accomplishing a similar goal, but significantly reducing alert fatigue by paging only on critical, user-visible service outages.
Architecture overview
The plan is to have a pair of Prometheus servers monitoring the entire TPA infrastructure but also external services. Configuration is performed using a mix of Puppet and GitLab repositories, pulled by Puppet.
Current
This is the current architecture:
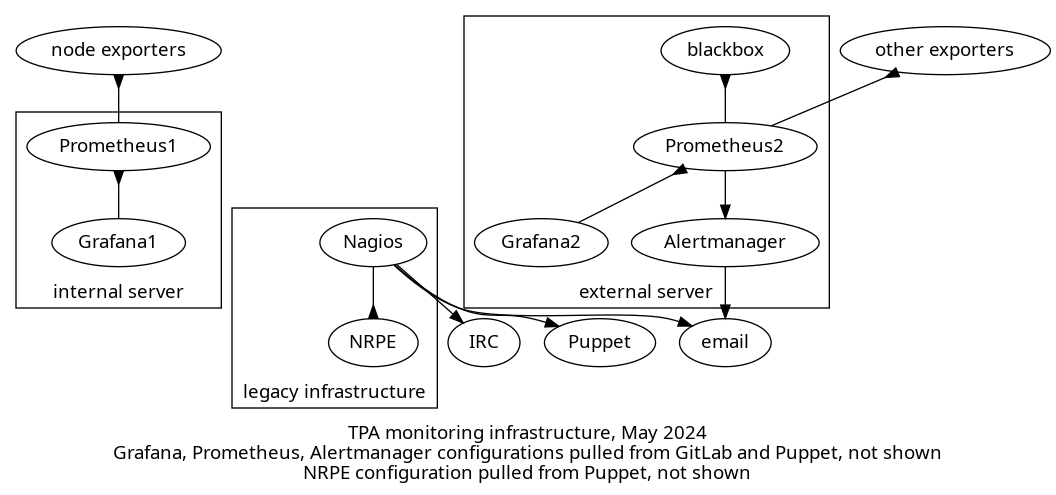
The above shows a diagram consisting of three different group of services:
-
legacy infrastructure: this is the Icinga server that pulls data from the NRPE servers and all sorts of other targets. the Icinga server pushes notifications by email and IRC, and also pushes NRPE configurations through Puppet
-
internal server: this server is managed solely by and for TPA and scrapes a node exporter on each TPA server, which provides system-level metrics like disk usage, memory, etc. It also scrapes other exporters like bind, apache, PostgreSQL and so on, not shown on the graph. A Grafana server allows browsing those time series, and its dashboard configuration is pulled from GitLab. Everything not in GitLab is managed by Puppet.
-
external server: this so-called "external server" is managed jointly by TPA and service admins, and scrapes data from a blackbox exporter and also other various exporters, depending on the services. It also has its own Grafana server, which also pulls dashboards from GitLab (not shown) but most dashboards are managed manually by service admins. It also has an Alertmanager server that pushes notifications over email. Everything not in GitLab is managed by Puppet.
Planned
The eventual architecture for the system might look something like this:
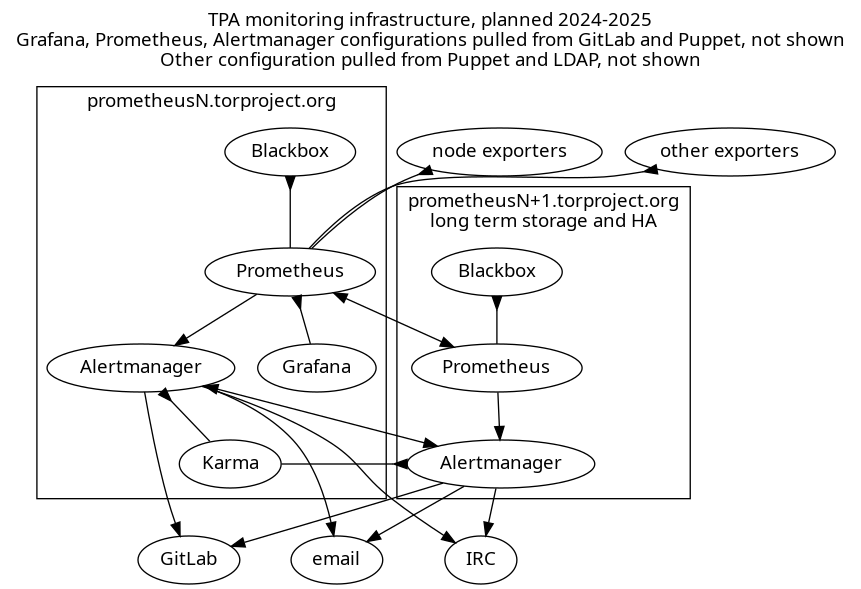
The above shows a diagram of a highly available Prometheus server setup. Each server has its own set of services running:
-
Prometheus: both servers pull metrics from exporters including a node exporter on every machine but also other exporters defined by service admins, for which configuration is a mix of Puppet and a GitLab repository pulled by Puppet.
The secondary server keeps longer term metrics, and the primary server has a "remote read" functionality to pull those metrics as needed. Both Prometheus servers monitor each other.
-
blackbox exporter: one exporter runs on each Prometheus servers and is scraped by its respective Prometheus server for arbitrary metrics like ICMP, HTTP or TLS response times
-
Grafana: the primary server runs a Grafana service which should be fully configured in Puppet, with some dashboards being pulled from a GitLab repository. Local configuration is completely ephemeral and discouraged.
It pulls metrics from the local Prometheus server at first, but eventually, with a long term storage server, will pull from a proxy.
In the above diagram, it is shown as pulling directly from Prom2, but that's a symbolic shortcut, it would only use the proxy as an actual data source.
-
Alertmanager: each server also runs its own Alertmanager which fires off notifications to IRC, email, or (eventually) GitLab, deduplicating alerts between the two servers using its gossip protocol.
-
Karma: the primary server runs this alerting dashboard which pulls alerts from Alertmanager and can issue silences.
Metrics: Prometheus
The core of the monitoring system is the Prometheus server. It is responsible for scraping targets on a regular interval, and write metrics to a time series database, keeping samples reliably, for as long as possible.
It has a set of alerting rules that determine error conditions, and pushes those alerts to the Alertmanager for notifications.
Configuration
The Prometheus server is currently configured mostly through Puppet, where modules define exporters and "export resources" that get collected on the central server, which then scrapes those targets.
Only the external Prometheus server does alerting right now, but that will change with the merge, as both servers will do alerting.
Configuration therefore needs to be both in Puppet (for automatic module configuration, e.g. "web server virtual host? then we check for 500 errors and latency") and GitLab (for service admins).
The current prometheus-alerts repository will remain as the primary source of truth for service admins alerts and targets, but we may eventually deploy another service discovery mechanism. For example, teams may be interested in exporting a Prometheus HTTP service discovery endpoint to list their services themselves.
Metrics targets are currently specified in the targets.d directory
for all teams.
It should be investigated whether it is worth labeling each target so
that, for example, a node exporter monitored by the network-health
team is not confused with the normal node exporter managed by
TPA. This might be possible through some fancy relabeling based
on the __meta_filepath from the file_sd_config parameter.
In any case, we might want to have a separate targets directory for TPA services than service admins. Some work is clearly necessary to clean up this mess.
Metrics types
In monitoring distributed systems, Google defines 4 "golden signals", categories of metrics that need to be monitored:
- Latency: time to service a request
- Traffic: transactions per second or bandwidth
- Errors: failure rates, e.g. 500 errors in web servers
- Saturation: full disks, memory, CPU utilization, etc
In the book, they argue all four should issue pager alerts, but we believe warnings for saturation, except for extreme cases ("disk actually full") might be sufficient.
The Metrics and alerts overview appendix gives an overview of the services we want to monitor along those categories.
Icinga metrics conversion
We assign each Icinga check an exporter and a priority:
- A: must have, should be completed before Icinga is shutdown, as soon as possible
- B: should have, would ideally be done before Icinga is shutdown, but we can live without it for a while
- C: nice to have, we can live without it
- D: drop, we wouldn't even keep checking this in Icinga if we kept it
- E: what on earth is this thing and how do we deal with it, to review
In the appendix, the Icinga checks inventory lists every Icinga check and what should happen with it.
Summary:
| Kind | Checks | A | B | C | D | E | Exporters |
|---|---|---|---|---|---|---|---|
| existing | 8 | 4 | 4 | 1 | |||
| missing, existing exporter | 8 | 5 | 3 | 3 | |||
| missing, new exporters | 8 | 4 | 4 | 8 | |||
| DNS | 7 | 1 | 6 | 3? | |||
| To investigate | 4 | 2 | 1 | 1 | 1 existing, 2 new? | ||
| dropped | 8 | 8 | 0 | ||||
| delegated to service admins | 4 | 4 | 4? | ||||
| new exporters | 0 | 14 (priority C) |
Checks by alerting levels:
- warning: 31
- critical: 3
- dropped: 12
Retention
We have been looking at longer-term metrics retention. This could be accomplished in a highly available setup, different servers have different retention policies and scrape interval. The primary server would have a short retention policy, similar or shorter to the current server (one year, 1 minute scrape interval) while the other has a longer retention policy (10 years, 5 minutes) and a larger disk, for longer term queries.
We have considered using the remote read functionality, which enables the primary server to read metrics from a secondary server, but it seems that might not work with different scrape intervals.
The last time we made an estimate, in May 2020, we had the following calculation for 1 minute polling interval over a year:
> 365d×1.3byte/(1min)×2000×78 to Gibyte
99,271238 gibibytes
At the time of writing (May 2024), the retention period and scrape intervals were unchanged (365 days, 15 seconds) and the disk usage (100GiB) roughly matched the above, so this seems to be a pretty reliably estimate. Note that the secondary server had much lower disk usage (3GiB).
This implies that we could store about 5 years of metrics with a 5 minute polling interval, using the same disk usage, obviously:
> 5*365d×1.3byte/(5min)×2000×78 to Gibyte
99,271238 gibibytes
... or 15 years with 15 minutes, etc... As a rule of thumb, as long as we multiple the scrape interval, we can multiply the retention period as well.
On the other side, we might be able to increase granularity quite a bit by lowering the retention to (say) 30 days and 5 seconds polling interval, which would give us:
> 30d*1.3byte/(5 second)*2000*78 to Gibyte
97,911358 gibibytes
That might be a bit aggressive though: the default Prometheus
scrape_interval is 15 seconds, not 5 seconds... With the defaults
(15 seconds scrape interval, 30 days retention), we'd be at about
30GiB disk usage, which makes for a quite reasonable and easy to
replicate primary server.
A few more samples calculations:
| Interval | Retention | Storage |
|---|---|---|
| 5 second | 30 days | 100 GiB |
| 15 second | 30 days | 33 GiB |
| 15 second | 1 year | 400 GiB |
| 15 second | 10 year | 4 TiB |
| 15 second | 100 year | 40 TiB |
| 1 min | 1 year | 100 GiB |
| 1 min | 10 year | 1 TiB |
| 1 min | 100 year | 10 TiB |
| 5 min | 1 year | 20 GiB |
| 5 min | 5 year | 60 GiB |
| 5 min | 10 year | 100 GiB |
| 5 min | 100 year | 1 TiB |
Note that scrape intervals close to 5 minutes are unlikely to work at all, as that will trigger Prometheus' stale data detection.
Naturally, those are going to scale up with service complexity and fleet size, so they should be considered to be just an order of magnitude.
For the primary server, a 30 day / 15 second retention policy seems lean and mean, while for the secondary server, a 1 minute interval would use 1TiB of data after one year, with the option of scaling by 100GiB per year almost indefinitely.
A key challenge is how to provide a unified interface with multiple servers with different datasets and scrape intervals. Normally, with a remote write / remote read interface, that is transparent, but it's not clear that it works if the other server has its own scraping. It might work with a "federate" endpoint... Others use the federate endpoint to pull data from short-term servers into a long term server, and use thanos to provide a single coherent endpoint.
Deploying Thanos is tricky, however, as it needs its own sidecars next to Prometheus to make things work, see this blurb. This is kept as an implementation detail to be researched later. Thanos is not packaged in Debian which would probably mean deploying it with a container.
There are other proxies too, like promxy and trickster which might be easier to deploy because their scope is more limited than Thanos, but neither are packaged in Debian either.
Self-monitoring
Prometheus should monitor itself and its Alertmanager for outages,
by scraping their metrics endpoints and checking for up metrics,
but, for Alertmanager, possibly also
alertmanager_config_last_reload_successful and
alertmanager_notifications_failed_total (source).
Prometheus calls this metamonitoring, which also includes the "monitoring server is up, but your configuration is empty" scenario. For example, they suggest a blackbox test that a metric pushed to the PushGateway will trigger an outgoing alert.
Some mechanism may be set to make sure alerts can and do get delivered, probably through a "dead man's switch" that continuously sends alerts and makes sure they get delivered. Karma has support for such alerts, for example, and prommsd is a standalone daemon that's designed to act as a webhook receiver for Alertmanager that will raise an alert back into the Alertmanager if it doesn't receive alerts.
Authentication
To unify the clusters as we intend to, we need to fix authentication on the Prometheus and Grafana servers.
Current situation
Authentication is currently handled as follows:
- Icinga: static
htpasswdfile, not managed by Puppet, modified manually when onboarding/off-boarding - Prometheus 1: static
htpasswdfile with dummy password managed by Puppet - Grafana 1: same, with an extra admin password kept in Trocla, using the auth proxy configuration
- Prometheus 2: static htpasswd file with real admin password deployed, extra password generated for prometheus-alerts continuous integration (CI) validation, all deployed through Puppet
- Grafana 2: static htpasswd file with real admin password for "admin" and "metrics", both of which are shared with an unclear number of people
Originally, both Prometheus servers had the same authentication system but that was split in 2019 to protect the external server.
Proposed changes
The plan was originally to just delegate authentication to
Grafana but we're concerned this is going to introduce yet another
authentication source, which we want to avoid. Instead, we should
re-enable the webPassword field in LDAP, which has been
mysteriously in userdir-ldap-cgi's 7cba921 (drop many fields from
update form, 2016-03-20), a trivial patch.
This would allow any tor-internal person to access the dashboards. Access levels would be managed inside the Grafana database.
Prometheus servers would reuse the same password file, allowing tor-internal users to issue "raw" queries, browse and manage alerts.
Note that this change will negatively impact the prometheus-alerts
CI which will require another way to validate its rulesets.
We have briefly considered making Grafana dashboards publicly available, but ultimately rejected this idea, as it would mean having two entirely different time series datasets, which would be too hard to separate reliably. That would also impose a cardinal explosion of servers if we want to provide high availability.
Trending: Grafana
We are already using Grafana to draw graphs from Prometheus metrics, on both servers. This would be unified on the single, primary server. The rationale is that Grafana does keep a lot of local state: access levels, dashboards, extra datasources are currently managed by hand on the secondary Grafana server, for example. Those local changes are hard to replicate, even though we actually want to avoid them in the long term...
Dashboard provisioning
We do intend to fully manage dashboards in the grafana-dashboards repository. But sometimes it's nice to just create a quick dashboard on the fly and not have to worry about configuration management in the short term. With multiple Grafana servers, this could get confusing quickly.
The grafana-dashboards repository currently gets deployed by Puppet from GitLab. That wouldn't change, except if we need to raise the deployment frequency in which case a systemd timer unit could be deployed to pull more frequently.
The foldersFromFilesStructure setting and current folder hierarchy will remain, to regroup dashboards into folders on the server.
We will keep the allowUiUpdates will remain disabled as we consider the risk of losing work is just too great then: if you're allowed to save, users will think Grafana will keep their changes, and rightly so.
An alternative to this approach would be to enable allowUiUpdates
and have a job that actually pulls live, saved changes to dashboards
and automatically commit them to the git repository, but at that point
it seems redundant to keep the dashboards in git in the first place,
as we lose the semantic meaning of commit logs.
Declarative dashboard maintenance
We may want to merge juga/grafhealth which uses grafanalib to generate dashboards from Python code. This would make it easier to review dashboard changes, as the diff would be in (hopefully) readable Python code instead of garbled JSON code, which often includes needless version number changes.
It still remains to be seen how the compiled JSON would be deployed on the servers. For now, the resulting build is committed into git, but we could also build the dashboards in GitLab CI and ship the resulting artifacts instead.
For now, such approach is encouraged, but the intermediate JSON form should be committed into the grafana-dashboards repository until we progressively convert to the new system.
Development server
We may setup a development Grafana server where operators can experiment on writing new dashboards, to keep the production server clean. It could also be a target of CI jobs that would deploy proposed changes to dashboards to see how they look like.
Alerting: Alertmanager, Karma
Alerting will be performed by Alertmanager, ideally in a high-availability cluster. Fully documenting Alertmanager is out of scope of this document, but a few glossary items seem worth defining here:
- alerting rules: rules defined, in PromQL, on the Prometheus
server that fire if they are true (e.g.
node_reboot_required > 0for a host requiring a reboot) - alert: an alert sent following an alerting rule "firing" from a Prometheus server
- grouping: grouping multiple alerts together in a single notification
- inhibition: suppressing notification from an alert if another is already firing, configured in the Alertmanager configuration file
- silence: muting an alert for a specific amount of time, configured through the Alertmanager web interface
- high availability: support for receiving alerts from multiple Prometheus servers and avoiding duplicate notifications between multiple Alertmanager servers
Configuration
Alertmanager configurations are trickier, as there is no "service discovery" option. Configuration is made of two parts:
- alerting rules: PromQL queries that define error conditions that trigger an alert
- alerting routes: a map of label/value matches to notification receiver that defines who gets an alert for what
Technically, the alerting rules are actually defined inside the Prometheus server but, for sanity's sake, they are discussed here.
Those are currently managed solely through the prometheus-alerts Git repository. TPA will start adding its own alerting rules through Puppet modules, but the GitLab repository will likely be kept for the foreseeable future, to keep things accessible to service admins.
The rules are currently stored in the rules.d folder in the Git
repository. They should be namespaced by team name so that, for
example, all TPA rules are prefixed tpa_, to avoid conflicts.
Alert levels
The current noise levels in Icinga are unsustainable and makes alert fatigue such a problem that we often miss critical issues before it's too late. And while Icinga operators (anarcat, in particular, has experience with this) have previously succeeded in reducing the amount of noise from Nagios, we feel a different approach is necessary here.
Each alerting rule MUST be tagged with at least labels:
severity: how important the alert isteam: which teams it belongs to
Here are the severity labels:
warning(new): non-urgent condition, requiring investigation and fixing, but not immediately, no user-visible impact; example: server needs to be rebootedcritical: serious condition with disruptive user-visible impact which requires prompt response; example: donation site gives a 500 error
This distinction is partly inspired from Rob Ewaschuk's Philosophy on Alerting which form the basis of Google's monitoring distributed systems chapter of the Site Reliability Engineering book.
Operators are strongly encourage to drastically limit the number and
frequency of critical alerts. If no label is provided, warning
will be used.
The team labels should be something like:
anti-censorshipmetrics(ornetwork-health?)TPA(new)
If no team label is defined, CI should yield an error, there will
NOT be a default fallback to TPA.
Dashboard
We will deploy a Karma dashboard to expose Prometheus alerts to operators. It features:
- silencing alerts
- showing alert inhibitions
- aggregate alerts from multiple alert managers
- alert groups
- alert history
- dead man's switch (an alert always firing that signals an error when it stops firing)
There is a Karma demo available although it's a bit slow and crowded, hopefully ours will look cleaner.
Silences & Inhibitions
Alertmanager supports two different concepts for turning off notifications:
-
silences: operator issued override that turns off notifications for a given amount of time
-
inhibitions: configured override that turns off notifications for an alert if another alert is already firing
We will make sure we can silence alerts from the Karma dashboard, which should work out of the box. It should also be possible to silence alerts in the built-in Alertmanager web interface, although that might require some manual work to deploy correctly in the Debian package.
By default, silences have a time limit in Alertmanager. If that becomes a problem, we could deploy kthxbye to automatically extend alerts.
The other system, inhibitions, needs configuration to be effective. Micah said it is worth spending at least some time configuring some basic inhibitions to keep major outages from flooding operators with alerts, for example turning off alerts on reboots and so on. There are also ways to write alerting rules that do not need inhibitions at all.
Notifications: IRC / Email
TPA will aggressively restrict the kind and number of alerts that will actually send notifications. This is done mainly by creating two different alerting levels ("warning" and "critical", above), and drastically limiting the number of critical alerts.
The basic idea is that the dashboard (Karma) has "everything": alerts (both with "warning" and "critical" levels) show up there, and it's expected that it is "noisy". Operators will be expected to look at the dashboard while on rotation for tasks to do. A typical example is pending reboots, but anomalies like high load on a server or a partition to expand in a few weeks is also expected.
Actual "critical" notifications will get sent out by email and IRC at first, to reproduce the current configuration. It is expected that operators look at their emails or the IRC channels regularly and will act upon those notifications promptly.
Some teams may opt-in to receiving warning notifications by email as well, but this is actually discouraged by this proposal.
No mobile
Like others we do not intend on having on-call rotation yet, and will not ring people on their mobile devices at first. After all exporters have been deployed (priority "C", "nice to have") and alerts properly configured, we will evaluate the number of notifications that get sent out and, if levels are acceptable (say, once a month or so), we might implement push notifications during business hours to consenting staff.
We have been advised to avoid Signal notifications as that setup is often brittle, Signal.org frequently changing their API and leading to silent failures. We might implement alerts over Matrix depending on what messaging platform gets standardized in the Tor project.
IRC
IRC notifications will be sent to the #tor-bots and
#tor-monitoring channels. At first we'll experiment with only
sending critical notifications there, but if we're missing out on
notifications, we might send warning notifications to those channels
and send critical notifications to the main #tor-admin channel.
The alertmanager-irc-relay endpoint is currently in testing in anarcat's lab, and the results are not fantastic, more research and tuning is required to get an acceptable level.
GitLab
It would be nice to have alerts show up in GitLab as issues so that work can be tracked alongside the rest of our kanban boards. The translation team has experimented with GitLab alerts and this serves as a good example of how that workflow could work if Alertmanager opens alerts in GitLab. TPA also uses incidents to track outages, so this would be a nice fit.
Typically, critical alerts would open alerts in GitLab and part of triage would require operators to make sure this queue is cleared up by the end of the week, or an incident created to handle the alert.
GitLab has a tool called helicopter to add notifications to issues when they reference a specific silence, repeatedly pinging operators for open issues, but we do not believe this is necessary.
Autonomous delivery
Prometheus servers currently do not have their own mail delivery system and relay mail through the central mail exchanger (currently eugeni). We probably should fix this and let the Alertmanager servers deliver mail directly to their targets, by adding them to SPF and DKIM records.
Pager playbook responses
One key difference between Nagios-style checks and Prometheus alerting
is that Nagios check results are actually text strings with lots of
meaning embedded into them. Checks for needrestart, for example,
might include the processes that need a kick, or dsa-check-packages
will list which packages need an upgrade.
Prometheus doesn't give us anything like this: we can have counts and labels, so we could know, for example, how many packages are "obsolete" or "pending upgrade" but not which.
So we'll need a mechanism to allow operators to easily extract that information. We believe this might be implemented using a Fabric script that replicates parts of what the NRPE checks currently do, which would also have the added benefit of more easily running those scripts in batch on multiple hosts.
Alerts should also include references to the "Pager playbook" sections of the service documentation, as much as possible, so that tired operators that deal with an emergency can follow a quick guide directly instead of having to search documentation.
Timeline
We will deploy this in three phase:
-
Phase A: short term conversion to retire Icinga to avoid running buster out of support for too long
-
Phase B: mid-term work to expand the number of exporters, high availability configuration
-
Phase C: further exporter and metrics expansion, long terms metrics storage
Phase A: emergency Icinga retirement, September 2024
In this phase we prioritize emergency work to replace core components of the Icinga server, so the machine can be retired.
Those are the tasks required here:
- deploy Alertmanager and email notifications on
prometheus1 - deploy alertmanager-irc-relay on
prometheus1 - deploy blackbox exporter on
prometheus1 - priority A metrics and alerts deployment
- Icinga server retirement
- deploy Karma on
prometheus1
We're hoping to start this work in June and finish by August or September 2024.
Phase B: merging servers, more exporters, October 2024
In this phase, we integrate more exporters and services in the infrastructure, which includes merging the second Prometheus server for the service admins.
We may retire the existing servers and build two new servers
instead, but the more likely outcome is to progressively integrate the
targets and alerting rules from prometheus2 into prometheus1 and then
eventually retire prometheus2, rebuilding a copy of prometheus1 in its
place.
Here are the tasks required here:
- LDAP web password addition
- new authentication deployment on
prometheus1 - cleanup
prometheus-alerts: add CI check for team label and regroup alerts/targets by team prometheus2merged intoprometheus1- priority B metrics and alerts deployment
- self-monitoring: Prometheus scraping Alertmanager, dead man's switch in Karma
- inhibitions
- port NRPE checks to Fabric
- once
prometheus1has all the data fromprometheus2, retire the latter
We hope to continue with this work promptly following phase A, in October 2024.
Phase C: high availability, long term metrics, other exporters, 2025
At this point, the vast majority of checks has been converted into Prometheus and we have reached feature parity. We are looking for "nice to have" improvements.
- prometheus3 server built for high availability
- autonomous delivery
- GitLab alert integration
- long term metrics: high retention, lower scrape interval on secondary server
- additional proxy setup as data source for Grafana (promxy or Thanos)
- faster dashboard deployments (systemd timer instead of Puppet pulling)
- convert dashboards to Grafanalib
- development Grafana server setup
- Matrix notifications
This work can wait for a while, probably starting and hopefully ending in 2025.
Challenges
Naming
Naming things, as usual, is hard. In this case, it's unclear what to
do with the current server names, which are already poorly named, as
prometheus1 and prometheus2 to not reflect the difference between
the two servers.
We're currently going with the assertion that prometheus1 will
remain and prometheus2 will be retired, and a new server will be
built in its place, which would logically be named prometheus3,
although we could also name it prometheus0 or prometheus-03.
Nagios and Icinga are sometimes used interchangeably even though we've
been running Icinga for years, for example the Git repository is named
tor-nagios.git while the target is clearly an Icinga server.
Alternatives considered
Designs
Keeping Icinga
We had a detailed back-and-forth about keeping Icinga for alerting but that was abandoned for a few reasons:
-
we had to rebuild the whole monitoring system anyway to switch to Inciga 2, and while there were existing Puppet modules for that, they were not actually deployed in our codebase (while Prometheus is fully integrated)
-
Incinga 2 requires running extra agents on all monitored servers, while we already have the node exporter running everywhere
-
Icinga is noisy by default, warning on all sorts of problems (like load) instead of forcing operators to define their own user-visible metrics
The main advantages of Icinga 2 were:
- Icingaweb is solid, featureful and really useful, with granular access controls
- Icinga checks ship with built-in thresholds that make defining alerts easier
Progressive conversion timeline
We originally wrote this timeline, a long time ago, when we had more time to do the conversion:
- deploy Alertmanager on prometheus1
- reimplement the Icinga alerting commands (optional?)
- send Icinga alerts through the alertmanager (optional?)
- rewrite (non-NRPE) commands (9) as Prometheus alerts
- scrape the NRPE metrics from Prometheus (optional)
- create a dashboard and/or alerts for the NRPE metrics (optional)
- review the NRPE commands (300+) to see which one to rewrite as Prometheus alerts
- turn off the Icinga server
- remove all traces of NRPE on all nodes
In that abandoned approach, we progressively migrate from Icinga to Prometheus by scraping Icinga from Prometheus. The progressive nature allowed for a possible rollback in case we couldn't make things work in Prometheus. This was ultimately abandoned because it seemed to take more time and we had mostly decided to do the migration, without the need for a rollback.
Fully redundant Grafana/Karma instances
We have also briefly considered setting up the same, complete stack on both servers:
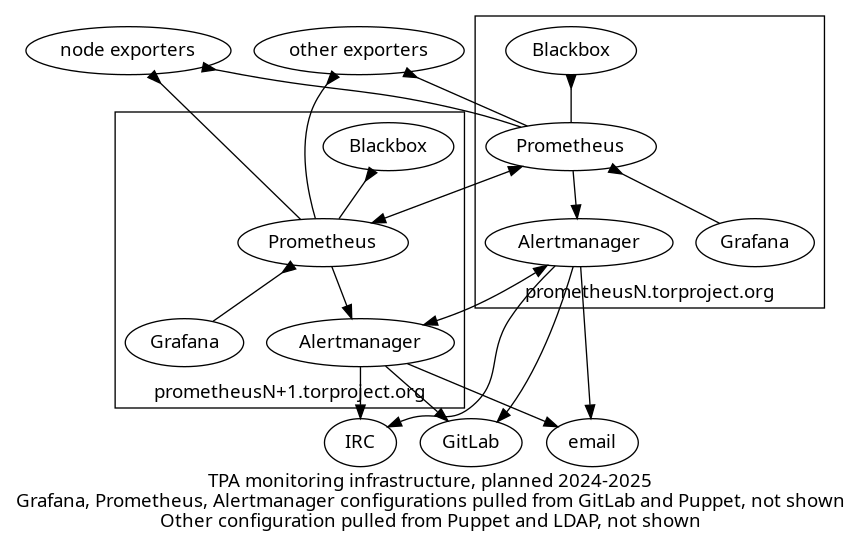
The above shows a diagram of a highly available Prometheus/Grafana server setup. Each server has its own set of services running:
-
Prometheus: both servers pulls metrics from all exporters including a node exporter on every machine but also other exporters defined by service admins
-
blackbox exporter: this exporter runs on every Prometheus server and is scraped by that Prometheus server for arbitrary metrics like ICMP, HTTP or TLS response times
-
Grafana: each server runs its own Grafana service, each Grafana server browses metrics from the local Prometheus database.
-
Alertmanager: each server also runs its own Alertmanager which fires off notifications to IRC, email, or (eventually) GitLab, deduplicating alerts between the two servers using its gossip protocol.
This feels impractical and overloaded. Grafana, in particular, would be tricky to configure as there is necessarily a bit of manual configuration on the server. Having two different retention policies would make it annoying as you would never quite know which server to use to browse data.
The idea of having a single Grafana/Karma pair is that if they are down, you have other things to worry about anyways. Besides: the Alertmanager will let operators know of the problem in any case.
If this becomes a problem over time, the setup could be expanded to replicate Karma, or even Grafana, but it feels superfluous for now.
Grafana for alerting
Grafana was tested to provide an unified alerting dashboard, but seemed insufficient. There's a builtin "dashboard" for alerts it finds already with the existing prometheus data source
It doesn't support silencing alerts.
It's possible to make grafana dashboards with queries as well, I found only a couple that only use the prometheus stats, most of the better ones use the Alertmanager metrics themselves. It also seems dashboards rely on Prometheus scraping metrics off the Alertmanager.
Grafana (the company) also built a Python-based incident response tool called oncall that seems interesting but a bit over-engineered for our needs.
Grafana also has its own alerting system and threshold, which can be baked in dashboards, but we have rejected this approach due to the difficulty of managing dashboards right now and the concern of depending on such a large stack for alerts. Alertmanager since like a much cleaner and simpler design, which less potential for failure.
Features
SLA and notifications improvements
We MAY introduce push notifications (e.g. with ntfy.sh or Signal) if we significantly trim down the amount of noise emanating from the monitoring server, and only if we send notifications during business hours of the affected parties.
If we do want to improve on SLA metrics, we should consider using Sloth, an "easy and simple Prometheus SLO (service level objectives) generator" which generates Grafana dashboards and alerts.
Sachet could be used to send SMS notifications.
Flap detection
Almost a decade ago, Prometheus rejected the idea of implementing
flap detection. The solutions proposed then were not fully
satisfactory, but now in Prometheus 2.42, there is a keep_firing_for
setting to further tweak alerts to avoid false positives, see also
this discussion.
We have therefore rejected flap detection as a requirement.
Dashboard variables consistency
One of the issues with dashboards right now is the lack of consistency
in variable names. Some dashboards use node, instance, alias or
host to all basically refer to the same thing, the frigging machine
on which the metrics are. That variability makes it hard to cross-link
dashboards and reuse panels.
We would love to fix this, but it's out of scope of this proposal.
Alerting rules unit tests
It's possible to write unit tests for alerting rules but this seems a little premature and overkill at this stage.
Other software
Cortex and TimescaleDB
Another option would be to use another backend for prometheus metrics, something like TimescaleDB, see this blog post for more information.
Cortex is also another Prometheus-compatible option.
Neither are packaged in Debian and our community has limited experience with both of those, so they were not seriously considered.
InfluxDB
In this random GitHub project, a user reports using InfluxDB instead of Prometheus for long term, "keep forever" metrics storage. it's tricky though: in 2017, InfluxDB added remote read/write support but then promptly went ahead and removed it from InfluxDB 2.0 in 2021. That functionality still seems available through Telegraf, which is not packaged in Debian (but is in Ubuntu).
After a quick chat with GPT-4, it appears that InfluxDB is somewhat of an "open core" model, with the multi-server, high availability features part of the closed-source software. This is based on a controversy documented on Wikipedia that dates from 2016. There's influxdb-relay now but it seems a tad more complicated than Prometheus' high availability setups.
Also, InfluxDB is a fundamentally different architecture, with a different querying system: it would be hard to keep the same alerts and Grafana dashboards across the two systems.
We have therefore completely excluded InfluxDB for now.
Grafana dashboard libraries
We have also considered options other than Grafanalib for Grafana dashboard management.
- grafana-dashboard-manager: doesn't seem very well maintained, with a bunch of bugfix PRs waiting in the queue for more than a year, with possible straight out incompatibility with recent Grafana versions
-
gdg: similar dashboard manager, could allow maintaining the grafana-dashboards repository manually, by syncing changes back and forth with the live instance
-
grizzly is based on JSONNET which we don't feel comfortable writing and reviewing as much as Python
Costs
Following the Kaplan-Moss estimation technique, as a reminder, we first estimate each task's complexity:
| Complexity | Time |
|---|---|
| small | 1 day |
| medium | 3 days |
| large | 1 week (5 days) |
| extra-large | 2 weeks (10 days) |
... and then multiply that by the uncertainty:
| Uncertainty Level | Multiplier |
|---|---|
| low | 1.1 |
| moderate | 1.5 |
| high | 2.0 |
| extreme | 5.0 |
Phase A: emergency Icinga retirement (4-6 weeks)
| Task | Estimate | Uncertainty | Total (days) |
|---|---|---|---|
| Alertmanager deployment | 1 day | low | 1.1 |
| alertmanager-irc-relay notifications | 3 days | moderate | 4.5 |
| blackbox deployment | 1 day | low | 1.1 |
| priority A metrics and alerts | 2 weeks | moderate | 15 |
| Icinga server retirement | 1 day | low | 1.1 |
| karma dashboard | 3 days | moderate | 4.5 |
| Total | 4 weeks | moderate | 27.5 |
Phase B: merging servers, more exporters (6-11 weeks)
| Task | Estimate | Uncertainty | Total (days) | Note |
|---|---|---|---|---|
| new authentication deployment | 1 day | low | 1.1 | trivial, includes LDAP changes |
prometheus-alerts cleanup | 1 day | moderate | 1.5 | |
| merge prometheus2 | 3 days | high | 6 | |
| priority B metrics and alerts | 1 week | moderate | 7.5 | |
| self-monitoring | 1 week | high | 10 | |
| inhibitions | 1 week | high | 10 | |
| port NRPE checks to Fabric | 2 weeks | high | 20 | could be broken down by check |
| Total | 6 weeks | ~high | 55 |
Phase C: high availability, long term metrics, other exporters (10-17 weeks)
| Task | Estimate | Uncertainty | Total (days) | Note |
|---|---|---|---|---|
| High availability | 3 weeks | high | 30 | |
| Autonomous delivery | 1 day | low | 1.1 | |
| GitLab alerts | 3 days | low | 3.3 | |
| Long term metrics | 1 week | moderate | 7.5 | includes proxy setup |
| Grafanalib conversion | 3 weeks | high | 30 | |
| Grafana dev server | 1 week | moderate | 7.5 | |
| Matrix notifications | 3 days | moderate | 4.5 | |
| Total | ~10 weeks | ~high | 17 weeks |
References
This proposal is discussed in tpo/tpa/team#40755.
Related issues
- Icinga server retirement issue
- automate deployment of Grafana dashboards
- exporter policy
- improve incident response procedures
- better monitoring for webserver response times
- longer-term metrics retention
Appendix
Icinga checks inventory
Here we inventory all Icinga checks and see how or if they will be
converted into Prometheus metrics and alerts. This was done by
reviewing config/nagios-master.cfg file in the tor-nagios.git
repository visually and extracting common checks.
Existing metrics
Those checks are present in Icinga and have a corresponding metric in Prometheus, and an alerting rule might need to be created.
| Name | Command | Type | P | Exporter | Metric | Rule level | Note |
|---|---|---|---|---|---|---|---|
| disk usage - * | check_disk | NRPE | A | node | node_filesystem_avail_bytes | warning / critical | disk full, critical when < 24h to full |
| load | check_load | NRPE | B | node | node_load1 or node_pressure_cpu_waiting_seconds_total | warning | sanity check, if using load, compare against CPU count |
| uptime check | dsa-check-uptime | NRPE | B | node | node_boot_time_seconds | warning | time()-node_boot_time_seconds (source), reboots per day: changes(process_start_time_seconds[1d]), alerting on crash loops |
| swap usage - * | check_swap | NRPE | B | node | node_memory_SwapFree_bytes | warning | sanity check, reuse checks from memory dashboard |
| network service - nrpe | check_tcp!5666 | local | A | node | up | warning | |
| network service - ntp peer | check_ntp_peer | NRPE | B | node | node_ntp_offset_seconds | warning | see also /usr/share/doc/prometheus-node-exporter/TIME.md |
| RAID -DRBD | dsa-check-drbd | NRPE | A | node | node_drbd_out_of_sync_bytes, node_drbd_connected | warning | DRBD 9 not supported, alternatives: ha_cluster_exporter, drbd-reactor |
| RAID - sw raid | dsa-check-raid-sw | NRPE | A | node | node_md_disks / node_md_state | warning | warns about inconsistent arrays, see this post |
| apt - security updates | dsa-check-statusfile | NRPE | A/B | node | apt_upgrades_* | warning | generated by dsa-check-packages, apt_info.py partial replacement existing (priority A), work remains (priority B) |
8 checks, 4 A, 4 B, 1 exporter.
Missing metrics requiring tweaks to existing exporters
| Name | Command | Type | P | Exporter | Metric | Rule level | Note |
|---|---|---|---|---|---|---|---|
| PING | check_ping | local | B | blackbox | probe_success | warning | critical after 1h? inhibit other errors? |
| needrestart | needrestart -p | NRPE | A | textfile | kernel_status, microcode_status | warning | not supported upstream, alternative implementation lacking |
| all services running | systemctl is-system-running | NRPE | B | systemd exporter | systemd_unit_state or node_systemd_unit_state | warning | sanity check, checks for failing timers and services, node exporter might do it but was removed in tpo/tpa/team#41070 |
| network service - sshd | check_ssh --timeout=40 | local | A | blackbox | probe_success | warning | sanity check, overlaps with systemd check, but better be safe |
| network service - smtp | check_smtp | local | A | blackbox | probe_success | warning | incomplete, need end-to-end deliverability checks |
| network service - submission | check_smtp_port!587 | local | A | blackbox? | probe_success | warning | |
| network service - smtps | dsa_check_cert!465 | local | A | blackbox? | ? | warning | |
| ud-ldap freshness | dsa-check-udldap-freshness | NRPE | B | textfile | TBD | warning | make a "timestamp of file $foo" metric, in this case /var/lib/misc/thishost/last_update.trace |
| network service - http | check_http | local | A | blackbox | probe_success, probe_duration_seconds | warning/critical | critical only for key sites, after significant delay, see also tpo/tpa/team#40568 |
| network service - https | check_https | local | A | idem | idem | idem | idem |
8 checks, 5 A, 3 B, 3 exporters.
Missing metrics requiring new upstream exporters
| Check | Type | P | Exporter | Metric | Rule level | Note |
|---|---|---|---|---|---|---|
dsa-check-cert-expire | NRPE | A | cert-exporter | TBD | warning | checks local CA for expiry, on disk, /etc/ssl/certs/thishost.pem and db.torproject.org.pem on each host |
check_ganeti_cluster | NRPE | B | ganeti-exporter | TBD | warning | runs a full verify, costly |
check_ganeti_instances | NRPE | B | idem | TBD | warning | currently noisy: warns about retired hosts waiting for destruction, drop? |
dsa_check_cert | local | A | cert-exporter | warning | check for cert expiry for all sites, the above will check for real user-visible failures, this is about "pending renewal failed", nagios checks for 14 days | |
dsa-check-unbound-anchors | NRPE | B | ??? | ? | warning? | checks if /var/lib/unbound files have the string VALID and are newer than 5 days, catches bug in unbound that writes empty files on full disk, fix bug? |
| "redis liveness" | NRPE | A | blackbox | TBD | warning? | checks that the Redis tunnel works, might require blackbox exporter, possibly better served by end-to-end donation testing? |
dsa-check-backuppg | NRPE | A | barman-exporter | TBD | warning | tricky dependency on barman rebuild, maybe builtin? |
check_puppetdb_nodes | NRPE | B | puppet-exporter | TBD | warning | |
dsa-check-bacula | NRPE | A | bacula-exporter | TBD | warning | see also WMF's check_bacula.py |
The "redis liveness" check is particularly tricky to implement, here is the magic configuration right now:
  -
    name: "redis liveness"
    nrpe: "if echo PING | nc -w 1 localhost 6379 | grep -m 1 -q +PONG; then echo 'OK: redis seems to be alive.'; else echo 'CRITICAL: Did not get a PONG from redis.'; exit 2; fi"
    hosts: crm-int-01

  -
    name: "redis liveness on crm-int-01 from crm-ext-01"
    nrpe: "if echo PING | nc -w 1 crm-int-01-priv 6379 | grep -m 1 -q +PONG; then echo 'OK: redis seems to be alive.'; else echo 'CRITICAL: Did not get a PONG from redis.'; exit 2; fi"
    hosts: crm-ext-01
9 checks, 5 A, 4 B, 8 possible exporters.
DNS and static system metrics
Those are treated specially because they are completely custom checks with lots of business logic embedded and, in the case of DNSSEC, actual side effects like automatic rotation and renewal.
| Name | Check | Type | P | Exporter | Rule level | Note |
|---|---|---|---|---|---|---|
| mirror (static) sync - * | dsa_check_staticsync | NRPE | C | textfile? | warning | runs on all mirrors, see if components are up to date, to rewrite? |
| DNS SOA sync - * | dsa_check_soas_add | NRPE | E | ??? | warning | checks that zones are in sync on secondaries |
| DNS - delegation and signature expiry | dsa-check-zone-rrsig-expiration-many | NRPE | E | dnssec-exporter | warning | TODO, drop DNSSEC? see also check_zone_rrsig_expiration which may be related |
| DNS - zones signed properly | dsa-check-zone-signature-all | NRPE | E | ??? | warning | idem |
| DNS - security delegations | dsa-check-dnssec-delegation | NRPE | E | ??? | warning | idem |
| DNS - key coverage | dsa-check-statusfile | NRPE | E | ??? | warning | idem, dsa-check-statusfile /srv/dns.torproject.org/var/nagios/coverage on nevii, could be converted as is |
| DNS - DS expiry | dsa-check-statusfile | NRPE | E | ??? | warning | idem, dsa-check-statusfile /srv/dns.torproject.org/var/nagios/ds on nevii |
7 checks, 1 C, 6 E, 3 resulting exporters?
To investigate
| Name | Command | Type | P | Possible exporter | Rule level | Note |
|---|---|---|---|---|---|---|
| system - filesystem check | dsa-check-filesystems | NRPE | B | node | warning | checks for fsck errors with tune2fs |
| network service - ntp time | check_ntp_time | NRPE | E | node | warning | unclear how that differs from check_ntp_peer |
2 checks, 1 B, 1 E, probably 1 existing exporter, 1 new.
Dropped checks
| Name | Command | Type | Rationale |
|---|---|---|---|
| users | check_users | NRPE | who has logged-in users?? |
| processes - zombies | check_procs -s Z | NRPE | useless |
| processes - total | check_procs 620 700 | NRPE | too noisy, needed exclusions for builders |
| processes - * | check_procs $foo | NRPE | better to check systemd |
| unwanted processes - * | check_procs $foo | NRPE | basically the opposite of the above, useless |
| LE - chain - see tpo/tpa/team#40052 | checks for flag file | NRPE | see below |
| CPU - intel ucode | dsa-check-ucode-intel | NRPE | overlaps with needrestart check |
| unexpected sw raid | checks for /proc/mdstat | NRPE | needlessly noisy, just means an extra module is loaded, who cares |
| unwanted network service - * | dsa_check_port_closed | local | needlessly noisy, if we really want this, use lzr |
| network - v6 gw | dsa-check-ipv6-default-gw | NRPE | useless, see tpo/tpa/team#41714 for analysis |
check_procs, in particular, was generating a lot of noise in
Icinga, as we were checking dozens of different processes, which would
all explode at once when a host would go down and Icinga didn't notice
the host being down.
In tpo/tpa/team#40052, weasel implemented a NRPE check like this:
  -
    name: "LE - chain - see tpo/tpa/team#40052"
    nrpe: "if [ -e /home/letsencrypt/non-X3-cert-encountered ]; then echo 'CRITICAL: found flag file'; exit 1; else echo 'OK: flag-file not found (good)'; fi"
    hosts: nevii
It's unclear what it does or why it is necessary, assuming sanity and dropping check.
8 checks, all priority "D", no new exporter.
Dropped checks to delegate to service admins
| Check | Type | P | Note |
|---|---|---|---|
| "bridges.tpo web service" | local | B | check_http on bridges.tpo |
| "mail queue" | NRPE | B | check_mailq on polyanthum |
tor_check_collector | NRPE | B | ??? |
tor-check-onionoo | NRPE | B | ??? |
4 checks, 4 B, possible 4 exporter.
Metrics and alerts overview
Priority A
- node exporter:
up, disk usage, RAID, DRBD, APT updates - blackbox: SSH, SMTP, HTTP(S) latency checks, Redis liveness
- textfile: needrestart (see above)
- cert-exporter: cert expiry for private CA and LE certs, see also tpo/tpa/team#41385 for alternatives
- barman-exporter: PostgreSQL backups validity
- bacula-exporter
Priority B
- node exporter: load, uptime, swap, NTP, systemd, filesystem checks
- blackbox: ping
- textfile: LDAP freshness
- ganeti exporter: running instances, cluster verification?
- unbound resolvers: ?
- puppet exporter: last run time, catalog failures
Priority C
- static mirrors freshness
- error detection and correction (EDAC) checks in the node exporter (
node_edac_correctable_errors_total) - fail2ban
- git exporter - latency for push/pull
- gitlab issue counts
- gitlab mail processing
- haproxy exporter
- hetzner exporter and hcloud exporter to monitor costs
- ipmi dashboard
- multiple viewpoint fingerprint checking
- network interfaces
- php-fpm exporter
- spamassassin: ham/spam/total counts, looks for
spamd: ((processing|checking) message|identified spam|clean message)in mail.log, could be replaced with mtail - technical debt
Priority D
Those Icinga checks were all dropped and have no equivalent.
Priority E
Those are all DNSSEC checks that we need to decide what to do with,
except check_ntp_time which seems to overlap with another check.
Icinga checks by priority
This duplicates the icinga inventory above, but sorts them by priority instead.
Priority A
| Check | Exporter | Metric | Rule level | Note |
|---|---|---|---|---|
check_disk | node | node_filesystem_avail_bytes | warning / critical | disk full, critical when < 24h to full |
check_nrpe | node | up | warning | |
dsa-check-drbd | node | node_drbd_out_of_sync_bytes, node_drbd_connected | warning | DRBD 9 not supported, alternatives: ha_cluster_exporter, drbd-reactor |
dsa-check-raid-sw | node | node_md_disks / node_md_state | warning | warns about inconsistent arrays, see this post |
needrestart -p | textfile | kernel_status, microcode_status | warning | not supported upstream, alternative implementation lacking |
check_ssh --timeout=40 | blackbox | probe_success | warning | sanity check, overlaps with systemd check, but better be safe |
check_smtp | blackbox | probe_success | warning | incomplete, need end-to-end deliverability checks |
check_smtp_port | blackbox | probe_success | warning | incomplete, need end-to-end deliverability checks |
check_http | blackbox | probe_success, probe_duration_seconds | warning/critical | critical only for key sites, after significant delay, see also tpo/tpa/team#40568 |
check_https | idem | idem | idem | idem |
dsa-check-cert-expire | cert-exporter | TBD | warning | checks local CA for expiry, on disk, /etc/ssl/certs/thishost.pem and db.torproject.org.pem on each host |
dsa_check_cert | cert-exporter | warning | check for cert expiry for all sites, the above will check for real user-visible failures, this is about "pending renewal failed", nagios checks for 14 days | |
| "redis liveness" | blackbox | TBD | warning? | checks that the Redis tunnel works, might require blackbox exporter, possibly better served by end-to-end donation testing? |
dsa-check-backuppg | barman-exporter | TBD | warning | tricky dependency on barman rebuild, maybe builtin? |
dsa-check-bacula | bacula-exporter | TBD | warning | see also WMF's check_bacula.py |
| "apt - security updates" | node | apt_upgrades_* | warning | partial, see priority B for remaining work |
Priority B
| Check | Exporter | Metric | Rule level | Note |
|---|---|---|---|---|
check_load | node | node_load1 or node_pressure_cpu_waiting_seconds_total | warning | sanity check, if using load, compare against CPU count |
dsa-check-uptime | node | node_boot_time_seconds | warning | time()-node_boot_time_seconds (source), reboots per day: changes(process_start_time_seconds[1d]), alerting on crash loops |
check_swap | node | node_memory_SwapFree_bytes | warning | sanity check, reuse checks from memory dashboard |
check_ntp_peer | node | node_ntp_offset_seconds | warning | see also /usr/share/doc/prometheus-node-exporter/TIME.md |
check_ping | blackbox | probe_success | warning | critical after 1h? inhibit other errors? |
systemctl is-system-running | systemd exporter | systemd_unit_state or node_systemd_unit_state | warning | sanity check, checks for failing timers and services, node exporter might do it but was removed in tpo/tpa/team#41070 |
dsa-check-udldap-freshness | textfile | TBD | warning | make a "timestamp of file $foo" metric, in this case /var/lib/misc/thishost/last_update.trace |
check_ganeti_cluster | ganeti-exporter | TBD | warning | runs a full verify, costly |
check_ganeti_instances | idem | TBD | warning | currently noisy: warns about retired hosts waiting for destruction, drop? |
dsa-check-unbound-anchors | ??? | ? | warning? | checks if /var/lib/unbound files have the string VALID and are newer than 5 days, catches bug in unbound that writes empty files on full disk, fix bug? |
check_puppetdb_nodes | puppet-exporter | TBD | warning | |
dsa-check-filesystems | node | TBD | warning | checks for fsck errors with tune2fs |
| "apt - security updates" | node | apt_upgrades_* | warning | apt_info.py implementation incomplete, so work remains |
Priority C
| Check | Exporter | Metric | Rule level | Note |
|---|---|---|---|---|
dsa_check_staticsync | textfile? | warning | runs on all mirrors, see if components are up to date, to rewrite? |
Priority D (dropped)
| Check | Rationale |
|---|---|
check_users | who has logged-in users?? |
check_procs -s Z | useless |
check_procs 620 | too noisy, needed exclusions for builders |
check_procs $foo | better to check systemd |
| weird Let's Encrypt X3 check | see below |
dsa-check-ucode-intel | overlaps with needrestart check |
| "unexpected sw raid" | needlessly noisy, just means an extra module is loaded, who cares |
dsa_check_port_closed | needlessly noisy, if we really want this, use lzr |
check_mailq on polyanthum | replace with end-to-end testing, not wanted by anti-censorship team |
tor_check_collector | delegated to service admins |
tor-check-onionoo | delegated to service admins |
check_http on bridges.tpo | delegate to service admins |
Priority E (to review)
| Check | Exporter | Rule level | Note |
|---|---|---|---|
dsa_check_soas_add | ??? | warning | checks that zones are in sync on secondaries |
dsa-check-zone-rrsig-expiration-many | dnssec-exporter | warning | TODO, drop DNSSEC? |
dsa-check-zone-signature-all | ??? | warning | idem |
dsa-check-dnssec-delegation | ??? | warning | idem |
| "DNS - key coverage" | ??? | warning | idem, dsa-check-statusfile /srv/dns.torproject.org/var/nagios/coverage on nevii, could be converted as is |
| "DNS - DS expiry" | ??? | warning | idem, dsa-check-statusfile /srv/dns.torproject.org/var/nagios/ds on nevii |
check_ntp_time | node | warning | unclear how that differs from check_ntp_peer |
Other queries ideas
- availability:
- how many hosts are online at any given point:
sum(count(up==1))/sum(count(up)) by (alias) - percentage of hosts available over a given period:
avg_over_time(up{job="node"}[7d])(source)
- how many hosts are online at any given point:
- memory pressure:
   # PSI alerts - in testing mode for now.
  - alert: HostMemoryPressureHigh
    expr: rate(node_pressure_memory_waiting_seconds_total[10m]) > 0.2
    for: 10m
    labels:
      scope: host
      severity: warn
    annotations:
      summary: "High memory pressure on host {{$labels.host}}"
      description: |
        PSI metrics report high memory pressure on host {{$labels.host}}:
          {{$value}} > 0.2.
        Processes might be at risk of eventually OOMing.
Similar pressure metrics could be used to alert for I/O and CPU usage.
Other implementations
Wikimedia Foundation
The Wikimedia foundation use Thanos for metrics storage and unified querying. They also have an extensive Grafana server setup. Those metrics are automatically uploaded to their Atlassian-backed status page with a custom tool called statograph.
They are using a surprisingly large number of monitoring tools. They seemed to be using Icinga, Prometheus, Shinken and LibreNMS, according to this roadmap, which plans to funnel all alerting through Prometheus' Alert Manager. As of 2021, they had retired LibreNMS, according to this wiki page, with "more services to come". As of 2024, their "ownership" page still lists Graphite, Thanos, Grafana, statsd, Alertmanager, Icinga, and Splunk On-Call.
They use karma as an alerting dashboard and Google's alertmanager-irc-relay to send notifications to IRC.
See all their docs about monitoring:
- https://wikitech.wikimedia.org/wiki/Prometheus
- https://wikitech.wikimedia.org/wiki/Alertmanager
- https://wikitech.wikimedia.org/wiki/Grafana.wikimedia.org
- https://wikitech.wikimedia.org/wiki/Thanos
- https://wikitech.wikimedia.org/wiki/Wikimediastatus.net
- https://wikitech.wikimedia.org/wiki/Icinga
- https://wikitech.wikimedia.org/wiki/SRE/Observability/Ownership
They also have a bacula dashboard.
A/I
Autistici built float to address all sorts of issues and have a good story around monitoring and auto-discovery. They have Ansible playboks to configure N non-persistent Prometheus servers in HA, then a separate "LTS" (Long Term Storage, not Support) server that scrapes all samples from the former over the "federation" endpoint and downsamples to one minute.
They use Thanos as proxy (and not for storage or compaction!) to provide a unified interface to both servers.
They also use Karma and Grafana as dashboards as well.
Riseup have deployed a similar system.
sr.ht
Sourcehut have a monitoring system based on Prometheus and Alertmanger. Their Prometheus is publicly available, and you can see their alerting rules and alerts, which are defined in this git repository.
Alerts are sorted in three categories.